
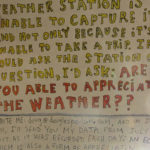
A Day & the Data, 2011. Intaglio, collage and ink on paper, 9.5 x 12.25 in. instagram.com/thatartistmark … [Read more...]
2010 – June – Tim Dye

WeatherDots, June 1-15, 2010, 2010. Digital print from series of 15, with color laser print key, 5 x 7 in. Depicting each day’s weather, 24 dots show weather conditions with color, shape, and orientation. Hourly weather readings control the shape’s appearance. See www.DataTechArt.org for details. @timsdye … [Read more...]
2010 – July – Douglas Paulson
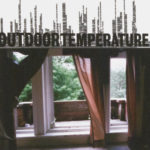
Appreciating the July, 2011. Laser print mounted on board, 8 x 5.375 inches. douglaspaulson.com … [Read more...]
2010 – August – Robyn York
Emotional Weather Report, Pigment print, 8 pp., 4.25 x 6 in. robynmakesstuff.wordpress.com … [Read more...]
2010 – September – Cross Current Resonance Transducer [LoVid (Tali Hinkis and Kyle Lapidus) and Douglas Repetto
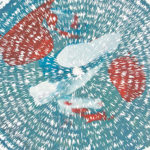
CCRT Spiral Sound Print, 2011. Data-driven laser cut screenprint on laser cut paper 10 in. diameter. Soundwave data from computer voice reading of SPWS indoor/outdoor temperature and humidity values plotted in an Archimedian spiral using custom software. Variable edition of 30–single report above, group of edition below. See www.music.columbia.edu/~douglas/portfolio/ccrt for … [Read more...]